


Debugging .NET Core Apps with Visual Studio Code
Jun 3, 2020 • 11 Minute Read
Introduction
Let's face it, our code doesn't always act the way we expect it to. Developers rely on many tools to help discover bugs and how they impact the code. Visual Studio Code includes such tools. In this guide you will learn about the integrated build and debug system included with Visual Studio Code for .NET Core development.
Setup
This guide assumes you have read my guide, Developing .NET Core Apps with Visual Studio Code. In it, you'll learn how to use the editor to quickly and accurately write C# apps. When you open a C# project the first time in Visual Studio Code, if you have the C# extension installed, you'll see a prompt in the lower right of the editor.
The C# extension is available from the Visual Studio Code Marketplace. To get the extension, press Ctrl-Shift-X / Cmd-Shift-X (all keyboard shortcuts in this guide are for macOS) to open the Extensions pane. In the search bar, search for "C#". Install the extension from Microsoft by clicking Install.
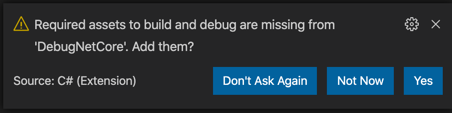
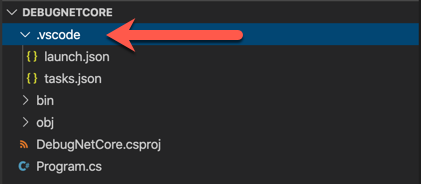
If you want to be able to debug your project in Visual Studio Code, select Yes and a .vscode directory will be added to your project.
After a while, the prompt will time out. If you miss it, you can still add the assets through the command palette. Press Ctrl-Shift-P / Cmd-Shift-P (all keyboard shortcuts in this guide are for macOS) and then search for the command .NET: Generate Assets for Build and Debug.
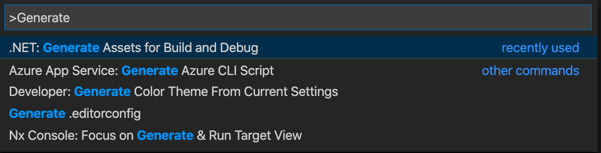
This will have the same result as confirming the prompt: a .vscode directory will be added to your project.
The Debug Pane
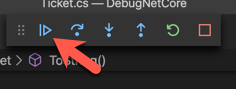
To follow along, clone the Github repository here and open it in Visual Studio Code. Accept the prompt to add the debugging assets. Open the debug pane in the sidebar by pressing Ctrl-Shift-D / Cmd-Shfit-D, or by clicking the icon highlighted below.

At the top of the debug pane you'll see a dropdown. It contains a list of configurations. For a console app like this one, the default configurations are .NET Core Launch (console) and .NET Core Attach. Select the Launch configuration and click the green Run button to the left to run the app.
Whoa! Something went wrong!

The app attempted to access a null value and threw a NullReferenceException. This is obviously not the kind of feature you want your users to see! Notice the app has paused execution on the line where the exception was thrown. The debugger is now active and you may inspect the state of the app in the debug pane.
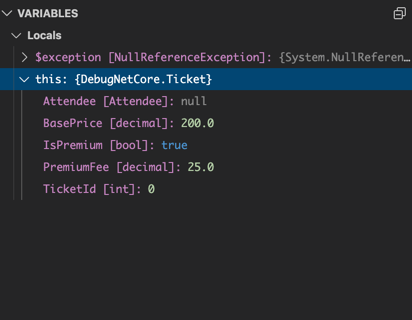
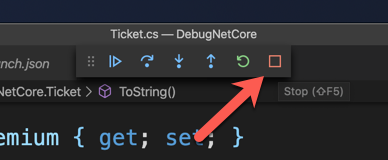
The offending code is attempting to access properties of a Ticket object. Expand the object in the VARIABLES section to see that the Attendee property is null. The code tries to access the FirstName property of the Attendee, which threw the exception. Stop the debugger by clicking the Stop button in the debug toolbar at the top of the editor.
Breakpoints
You don't have to wait for an exception. Setting a breakpoint will stop execution of the app under any circumstances in the debugger. First, in Program.cs add an Attendee to the Ticket instance.
      var ticket = new Ticket
{
  TicketId = faker.UniqueIndex,
  BasePrice = 200.0m,
  PremiumFee = 25.0m,
  IsPremium = true,
  Attendee = new Attendee
  {
    FirstName = "John",
    LastName = "Doe"
  }
};
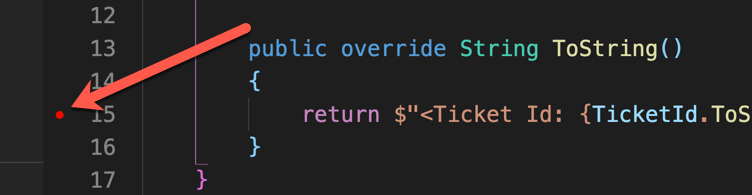
Now back in Ticket.cs click to the left of the line number 15. A red circle will represent the breakpoint.
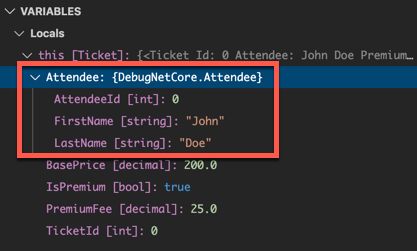
In the debug pane, click the Run button again. The app will pause before executing line 15 in Ticket.cs. But this time, it doesn't pause for an error. Check the VARIABLES section again to see that Attendee now has a FirstName and LastName property.
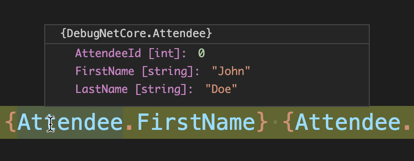
Notice that the line with the breakpoint is highlighted in the editor. You can hover over the code to see the values of variables.
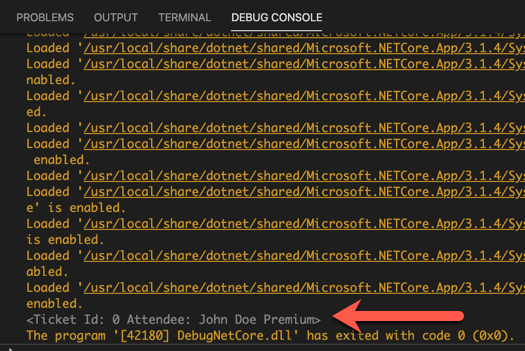
Click the Continue button in the debug toolbar to finish execution and see the output of the app in the Debug Console.
Remove the breakpoint by clicking on it before continuing.
Configurations
Make a small change to the Ticket object in Program.cs.
      var ticket = new Ticket
{
  TicketId = faker.UniqueIndex,
  BasePrice = 200.0m,
  PremiumFee = 25.0m,
  IsPremium = true,
  Attendee = new Attendee
  {
    FirstName = args[0],
    LastName = args[1]
  }
};
Now the Attendee will be initialized using values from the command line arguments. (Remember in C# the first index of args is the first command line argument. The app name is not passed as an argument.) Run the app. It crashes again, but this time it's an IndexOutOfRangeException. Look at the debug pane to see why.
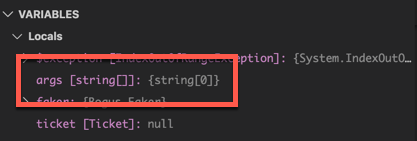
args is a array of String but the array is empty. Thus, when the app tried to set the FirstName of the Attendee to the first command line argument at args[0] there was no element at index 0. If the app were run at the command line this would be easy to fix. But how can you pass arguments to a command line app in the debugger?
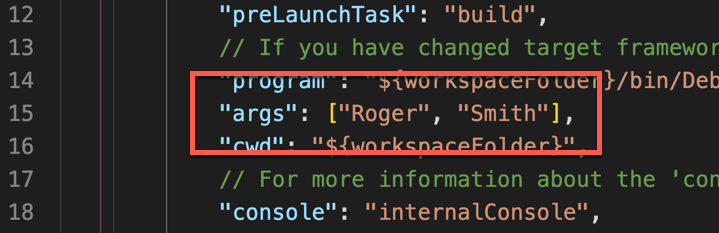
Remember the build and debug assets you generated the first time the project was opened? Look in the .vscode directory and open the launch.json file. This is where the configurations are defined. Notice that there is a configuration for each option in the dropdown in the debug pane. In the first configuration, there is a key for args, which is an array. The elements in the array will be passed as command line arguments when debugging the app. Edit the configuration to include two strings.
Replace the breakpoint on line 15 in Ticket.cs and run the app again. This time, the breakpoint stops the app. Look in the debug pane and inspect the Attendee property. It will have the values you added to the args key in the configuration.
Debugging a Web App
Clone the GitHub repo here and open it in Visual Studio Code. Generate the build and debug assets and open the debug pane. This time the project is an ASP.NET Core Razor Pages app. Notice the first configuration is now for a web app and not a console app.
Open the Pages directory and the Index.cshtml.cs file. Set a breakpoint on the first line of the OnGet method and run the app from the debug pane. The breakpoint will pause the app. In the debug pane, observe the value of newTicket. Right now it's null. Step through the code by clicking the Step Over button.

As you click, the lines of the method will run and the newTicket will be populated. You can see the values of newTicket update in the debug pane.
But wait! There's more! Stop the app and remove the breakpoint. Now open Index.cshtml. Set a breakpoint on line 17. Run the app again.

You can even debug the Razor Pages with markup and inspect the values of variables!
One more thing: right now, to see any changes made to the web app you would have to stop the app and restart it again. This is tedious. To have the app restart automatically, you can run the command dotnet watch run in the terminal. But now the app cannot make use of the debugger. Fortunately, there is a second configuration that can help with this. The .NET Core Attach configuration will attach to a running process.
Start the app with dotnet watch run in the terminal. Select the attach configuration in the debug pane and click the Run button.
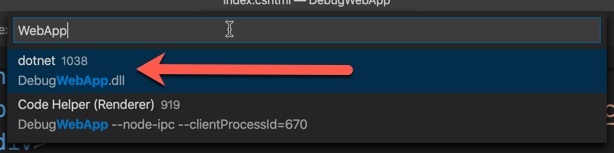
Visual Studio Code will find all the processes it thinks it can attach to. This can be quite a long list. If you search for the name of your project, and look for a .dll file being run by a dotnet process, that is the one you want. Select it and you've got all of the debugger plus the convenience of the watch command. Notice that the debug toolbar now shows a Disconnect button instead of a Stop button.
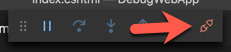
Clicking it will stop the debugger, but not the development server. You'll still need to stop that process from the terminal.
Conclusion
In this guide you learned about the build and debug system for .NET Core projects in Visual Studio Code. A lot of it is provided by the C# extension. You saw how to use the debug pane to inspect the state of an app. You also saw how to use configurations. You debugged both console and web apps. And you saw how to attach the debugger to a currently running process. If you're curious, take a look at debugging remote processes.
To learn about testing .NET core apps with Visual Studio Code, check out this guide. Thanks for reading!

Advance your tech skills today
Access courses on AI, cloud, data, security, and more—all led by industry experts.
