


Explore Python Libraries: Dash
Jun 24, 2020 • 13 Minute Read
Introduction
Every data scientist can benefit from knowing how to present their work in an interactive and visually appealing dashboard. With the Dash Python library, you can create stylish custom dashboards without having an extensive background in web app development. With this guide, you will be making dashboards to impress your colleagues and supervisors in no time.
Dash is an open-source Python library built on top of React.js, Flask, and Plotly.js. The great thing about Dash is that full-stack apps that would typically require a front-end, back-end, and DevOps team to build can now be deployed in hours by data scientists.
Overview of a Dash Application
Dash applications typically consist of two parts. In the first part, the layout, you specify how the app is going to look to a user. In the second part, the callbacks section, you specify the interactivity of the app.
The layout is composed of HTML classes, whose syntax is almost identical to HTML. The callbacks section consists of specifications for how interaction with HTML (and other) elements in the layout should affect the elements of your app via Python functions.
Designing a Deep Neural Network Image Prediction Dashboard
The following sections will teach you how to create a dashboard to display the results of a deep neural network for image prediction. Concretely, you will create a dashboard that loads a pre-trained neural network model and a dataset of images, uses the model to predict on the dataset, and then displays the images as well as predictions of the model to the user dynamically.

Installation
Start by installing Dash. Simply run
pip install dash
and Dash is ready for use!
Loading a Pre-Trained Model
The model you will display in your dashboard has been pre-trained and is available, along with the rest of the code, at https://github.com/emmanueltsukerman/Dash-Tutorial.
In particular, the model is a simple Convolutional Neural Network (CNN) for learning MNIST. As part of your dashboard, you will load this pre-trained model using this code:
      from keras.models import Sequential
from keras.layers import Dense, Dropout, Flatten
from keras.layers import Conv2D, MaxPooling2D
from tensorflow.keras.models import load_model


def load_MNIST_model(model_path="MNIST_model"):
    img_rows, img_cols = 28, 28
    input_shape = (img_rows, img_cols, 1)
    model = Sequential()
    model.add(
        Conv2D(32, kernel_size=(3, 3), activation="relu", input_shape=input_shape)
    )
    model.add(Conv2D(64, (3, 3), activation="relu"))
    model.add(MaxPooling2D(pool_size=(2, 2)))
    model.add(Dropout(0.25))
    model.add(Flatten())
    model.add(Dense(128, activation="relu"))
    model.add(Dropout(0.5))
    model.add(Dense(10, activation="softmax"))

    model.compile(
        loss=keras.losses.categorical_crossentropy,
        optimizer=keras.optimizers.Adadelta(),
        metrics=["accuracy"],
    )
    loaded_model = load_model(r".\MNIST_model")
    return loaded_model
So to get started, clone the repository. In the cloned folder, create a new Python file called app_working.py. This will be the file you will be coding your Dash dashboard source code into, and will eventually look just like app.py.
Paste the block of code above into app_working.py. You will run this code as part of the initialization of the dashboard, since it can be run just once, at app startup.
Next, load the dataset. Paste the following code block to load MNIST:
      import keras
from keras.datasets import mnist
from keras import backend as K


def load_MNIST_dataset():
    (x_train, y_train), (x_test, y_test) = mnist.load_data()
    x_train = x_train.astype("float32")
    x_test = x_test.astype("float32")
    x_train /= 255
    x_test /= 255
    y_train = keras.utils.to_categorical(y_train, 10)
    y_test = keras.utils.to_categorical(y_test, 10)
    return x_train, x_test, y_train, y_test
Finally, you will want to run these functions when the dashboard is loaded, so paste the lines below into your file app_working,py:
      x_train, x_test, y_train, y_test = load_MNIST_dataset()
MNIST_model = load_MNIST_model()
Dash Imports
Before beginning to configure the layout and interactivity, import Dash and its libraries.
      import dash
import dash_core_components as dcc
import dash_html_components as html
from dash.exceptions import PreventUpdate
The library dash_html_components contains a Dash version of every typical HTML component. For example, there are:
- html.H1(…) corresponding to <h1></h1>
- html.div(…) corresponding to <div></div>
- html.label(...) corresponding to <label></label>
There are also many other HTML components.
The library dash_core_components contains interactive components generated using JS, HTML, CSS and ReactJS. This includes components such as:
- dcc.Input(…) which is an element accepting user input
- dcc.Graph(…), an element for rendering plots
- dcc.Markdown(…) for displaying Markdown
It also includes many other components. The PreventUpdate function will be used later to control the flow of execution in your dashboard.
Now that you’re familiar with these imports, also include this at the head of your code:
      external_stylesheets = ["https://codepen.io/chriddyp/pen/bWLwgP.css"]
app = dash.Dash(__name__, external_stylesheets=external_stylesheets)
These imports enable you to utilize a CSS stylesheet to style your dashboard.
Add an empty layout (for now) by pasting the line:
app.layout = html.Div()
Now at the bottom of your file, add:
      if __name__ == "__main__":
    app.run_server(debug=True)
Running the Dashboard
At this point, you should be able to run the app and initialize the model. To run the app, in your terminal, execute:
python app_working.py
If you encounter any problems, odds are that your version of TensorFlow or Keras differs from the one used to train the model (TensorFlow==2.2.0 and Keras==2.3.1).

Opening a browser at https://127.0.0.1:8050/, you should see an empty dashboard except for a debugging menu button on the bottom right corner.
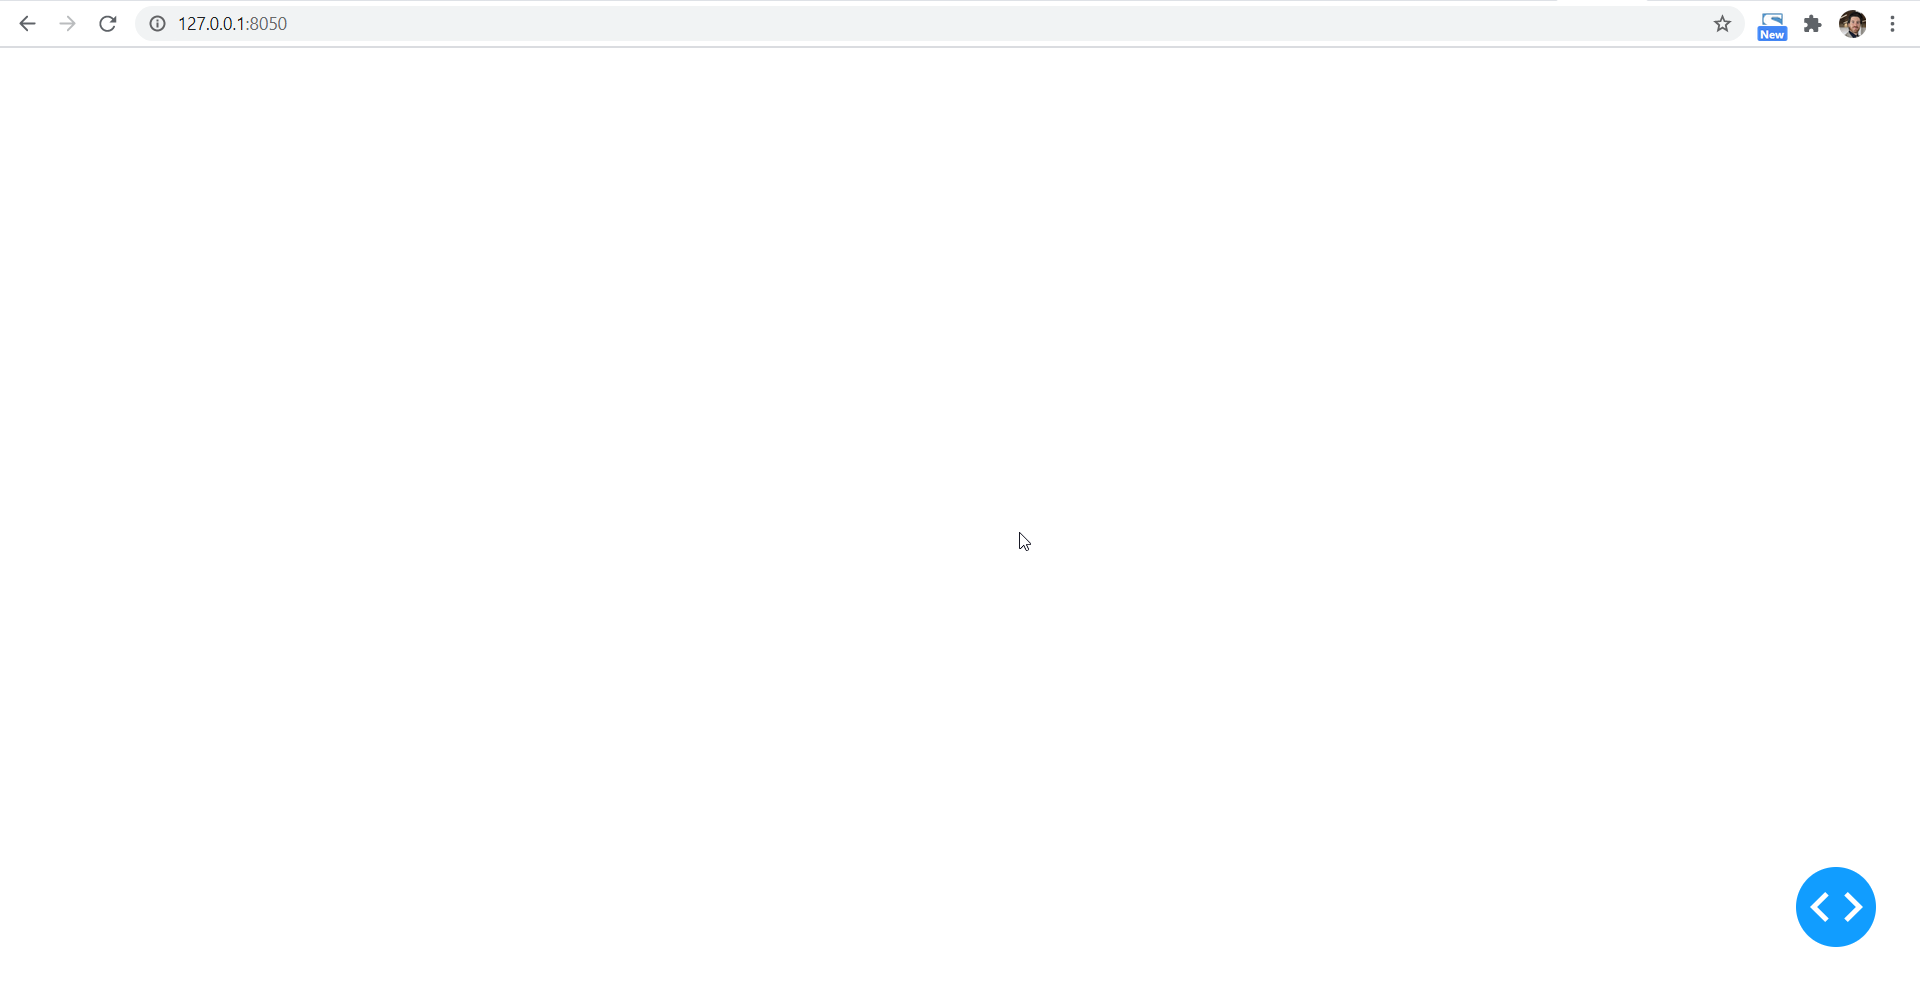
One nifty feature of Dash is that it is hot-reloading, meaning that as you make changes to the code, your browser will automatically refresh. In other words, you don’t need to rerun the app each time you make a code change.
Designing the Layout
The layout consists of a series of HTML and other elements. The architecture of your layout will be as follows:
      app.layout = html.Div(
    style={"textAlign": "center"},
    children=[
        title,
        subtitle,
        button,
        space,
        sample_image,
        model_prediction,
        intermediate,
    ],
)
Breaking this down, first, the layout as a whole is a div into which the subcomponents will be inserted. Second, by setting textAlign to center, you are applying a CSS style to all components that will vertically center all components on the page. Next, there is a series of variables, which you will now declare.
      title = html.H1(children="Deep Neural Network Model for MNIST")
subtitle = html.Div(
    style={"padding-bottom": 10},
    children="Click button to pick a random image from the MNIST dataset and display the deep neural network's prediction on that image.",
)
button = html.Button(children="Predict Random Image", id="submit-val")
space = html.Br()
sample_image = html.Img(
    style={"padding": 10, "width": "400px", "height": "400px"}, id="image"
)
model_prediction = html.Div(id="pred", children=None)
intermediate = html.Div(id="intermediate-operation", style={"display": "none"})
- title is simply an H1 element containing the title of your dashboard as a text.
- subtitle is similar to title but is a div and has a smaller font. It also has additional styling, having extra padding on the bottom.
- button is an HTML button that you will hook up in the callbacks section.
- space is an HTML <br> to create a line break.
- sample_image is a component for displaying an image. Its style attribute specifies the size and padding of the image.
- model_prediction is another div just like subtitle. It will display the prediction of the model, and you’ll hook it up later.
- intermediate is a hidden div, meaning it is invisible to users. Its purpose is to hold data that can be used in callbacks. More on this later.
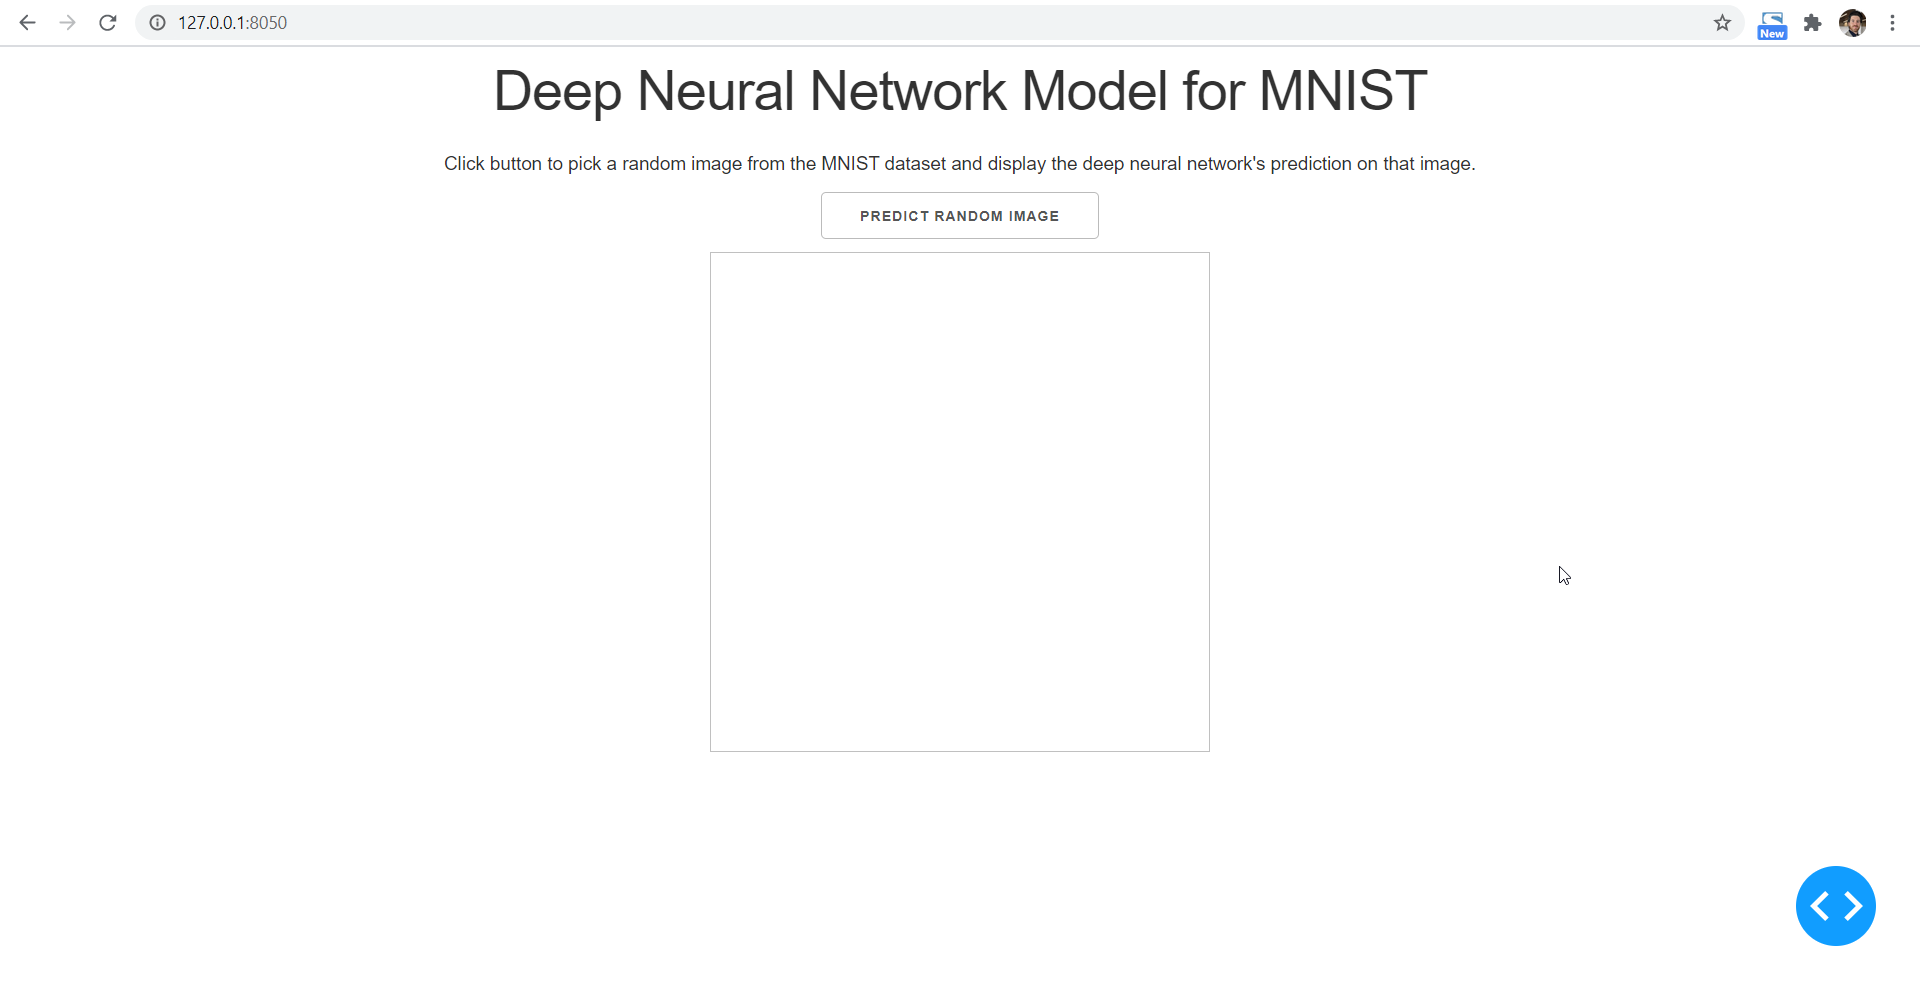
At this point, your layout should look as follows:
Adding Interactivity
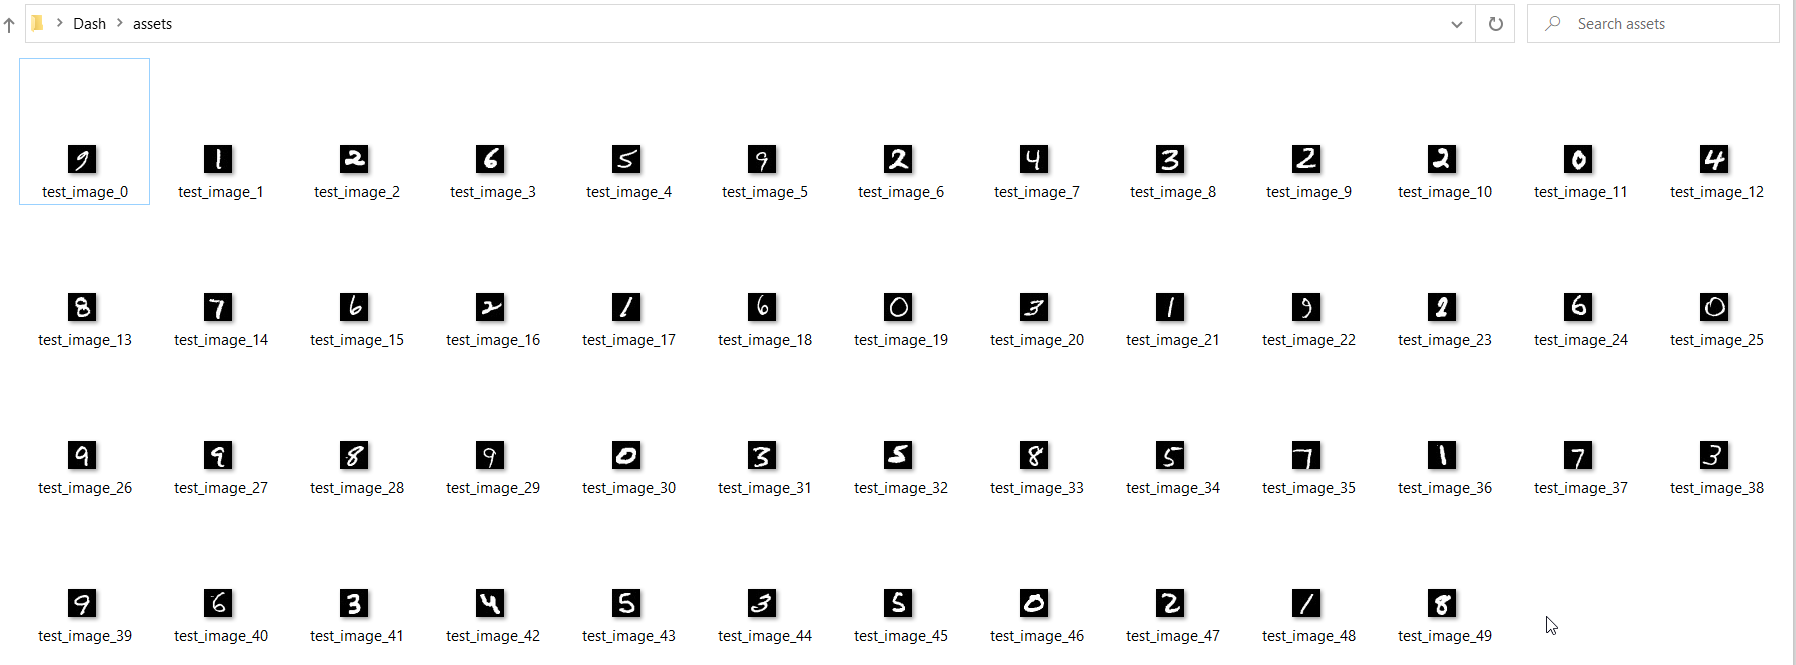
Next, you will add a random sample of images to the assets folder. This folder is available to your Dash application for storing and loading images.
Simply add the following code block to the initialization part of your application (next to the code for loading MNIST and the model):
      NUM_IMAGES = 50
import numpy as np
from PIL import Image


def save_random_images(num_images):
    np.random.shuffle(x_test)
    for i in range(num_images):
        sample = x_test[i]
        sample = sample.reshape([28, 28])
        im = Image.fromarray(sample * 255)
        im = im.convert("RGB")
        im.save("assets/test_image_" + str(i) + ".png")


save_random_images(NUM_IMAGES)
When the dashboard is run, you should see NUM_IMAGES=50 images appear in your assets folder.
The plan you will execute now is to have a click on PREDICT RANDOM IMAGE pick one of these images at random and display it along with the model’s prediction on it. To do that, you must instruct Dash to recognize when the button is clicked and then run a function, called a callback.
To do that, add this code block below your layout:
      import random


@app.callback(
    dash.dependencies.Output("intermediate-operation", "children"),
    [dash.dependencies.Input("submit-val", "n_clicks")],
)
def update_random_image(n_clicks):
    if n_clicks is None:
        raise PreventUpdate
    else:
        return random.choice(range(NUM_IMAGES))
In this block, you see a @app.callback decorator. In it, you specify what changes to look for (the Input), and what needs to be updated (the Output). In particular, submit-val refers to the button’s ID. The n_clicks property counts how many times the button was clicked. When it is clicked, it gets incremented, and in particular, changes. The intermediate-operation is the ID of the intermediate div. Its children attribute will change.
Below the callback function declaration, you see the actual function that will be called, namely, update_random_image. PreventUpdate is used here to prevent the image displaying at the dashboard's initialization. If you click on the button, a random number between 0 and NUM_IMAGES is stored in the intermediate div.
The reason for doing so is that this number will be used both to update the image div and also the prediction div. In other words, it is shared data for two callbacks.
Next, a callback monitoring this intermediate div is used to update the image:
      @app.callback(
    dash.dependencies.Output("image", "src"),
    [dash.dependencies.Input("intermediate-operation", "children")],
)
def update_figure(img_number):
    return app.get_asset_url("test_image_" + str(img_number) + ".png")
And another callback is used to update the prediction div:
      @app.callback(
    dash.dependencies.Output("pred", "children"),
    [dash.dependencies.Input("intermediate-operation", "children")],
)
def update_prediction(img_number):
    img = x_test[img_number]
    img = img.reshape([1, 28, 28, 1])
    predicted_class = MNIST_model.predict_classes(img)[0]
    return "Prediction: " + str(predicted_class)
And that’s really all there is to the code.
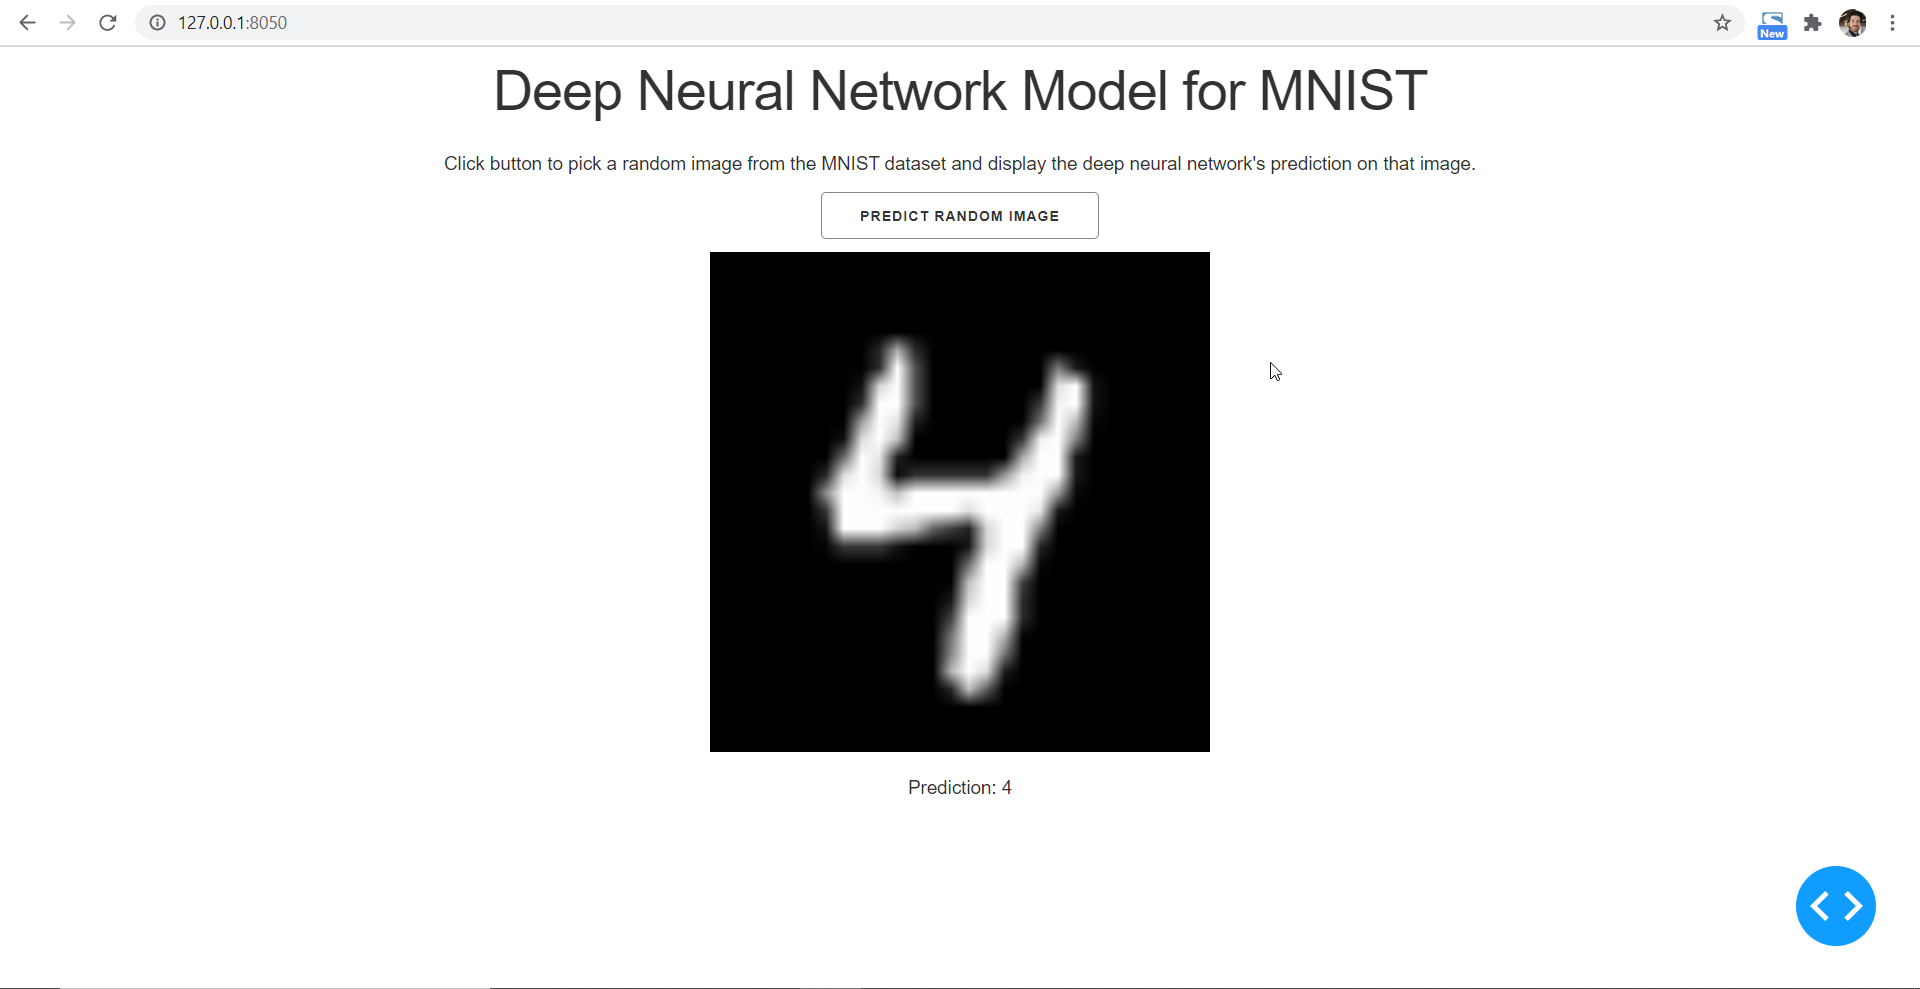
You can now see how a deep neural network model is performing interactively.
Conclusion
Congratulations! You have taken a pre-trained model and displayed its results using a Dash dashboard you built from scratch. Now that you know the basics of how to design and add interactivity to a dashboard, the sky is the limit. Great next steps for making beautiful dashboards include adding plots and allowing users to interact with them, which you can learn at https://dash.plotly.com/interactive-graphing. Happy learning!

Advance your tech skills today
Access courses on AI, cloud, data, security, and more—all led by industry experts.

